Deep-dive into Spark internals and architecture
Apache Spark is an open-source distributed general-purpose cluster-computing framework. A spark application is a JVM process that’s running a user code using the spark as a 3rd party library.
As part of this blog, I will be showing the way Spark works on Yarn architecture with an example and the various underlying background processes that are involved such as:
- Spark Context
- Yarn Resource Manager, Application Master & launching of executors (containers).
- Setting up environment variables, job resources.
- Coarse Grained Executor Backend & Netty-based RPC.
- Spark Listeners.
- Execution of a job (Logical plan, Physical plan).
- Spark-WebUI.
Spark Context
Spark context is the first level of entry point and the heart of any spark application. Spark-shell is nothing but a Scala-based REPL with spark binaries which will create an object sc called spark context.
We can launch the spark shell as shown below:
spark-shell --master yarn \ --conf spark.ui.port=12345 \ --num-executors 3 \ --executor-cores 2 \ --executor-memory 500MAs part of the spark-shell, we have mentioned the num executors. They indicate the number of worker nodes to be used and the number of cores for each of these worker nodes to execute tasks in parallel.
Or you can launch spark shell using the default configuration.
spark-shell --master yarnThe configurations are present as part of spark-env.sh

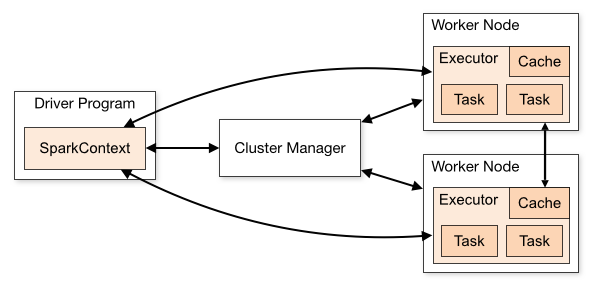
Our Driver program is executed on the Gateway node which is nothing but a spark-shell. It will create a spark context and launch an application.

The spark context object can be accessed using sc.

After the Spark context is created it waits for the resources. Once the resources are available, Spark context sets up internal services and establishes a connection to a Spark execution environment.
Yarn Resource Manager, Application Master & launching of executors (containers).
Once the Spark context is created it will check with the Cluster Manager and launch the Application Master i.e, launches a container and registers signal handlers.


Once the Application Master is started it establishes a connection with the Driver.

Next, the Application Master End Point triggers a proxy application to connect to the resource manager.

Now, the Yarn Container will perform the below operations as shown in the diagram.
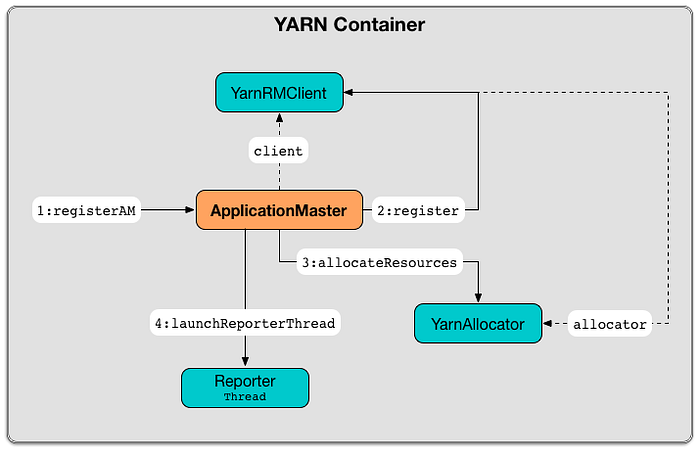
ii) Yarn RM Client will register with the Application Master.

iii) Yarn Allocator: Will request 3 executor containers, each with 2 cores and 884 MB memory including 384 MB overhead

iv) AM starts the Reporter Thread

Now the Yarn Allocator receives tokens from Driver to launch the Executor nodes and start the containers.

Setting up environment variables, job resources & launching containers.
Every time a container is launched it does the following 3 things in each of these.
- Setting up env variables
Spark Runtime Environment (Spark Env) is the runtime environment with Spark’s services that are used to interact with each other in order to establish a distributed computing platform for a Spark application.


- Setting up job resources


YARN executor launch context assigns each executor with an executor id to identify the corresponding executor (via Spark WebUI) and starts a Coarse Grained Executor Backend.

Coarse Grained Executor Backend & Netty-based RPC.
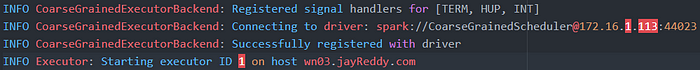
After obtaining resources from Resource Manager, we will see the executor starting up

Coarse Grained Executor Backend is an Executor Backend that controls the lifecycle of a single executor. It sends the executor’s status to the driver.
When Executor Runnable is started, Coarse Grained Executor Backend registers the Executor RPC endpoint and signal handlers to communicate with the driver (i.e. with Coarse Grained Scheduler RPC endpoint) and to inform that it is ready to launch tasks.
Netty-based RPC - It is used to communicate between worker nodes, spark context, executors.

Netty RPC End Point is used to track the result status of the worker node.
Rpc Endpoint Address is the logical address for an endpoint registered to an RPC Environment, with Rpc Address and name.
It is in the format as shown below:

This is the first moment when Coarse Grained Executor Backend initiates communication with the driver available at driver Url through RpcEnv.

Spark Listeners
Spark Listener (Scheduler listener) is a class that listens to execution events from Spark’s DAG Scheduler and logs all the event information of an application such as the executor, driver allocation details along with jobs, stages, and tasks and other environment properties changes.
Spark Context starts the Live Listener Bus that resides inside the driver. It registers Job Progress Listener with Live Listener Bus which collects all the data to show the statistics in spark UI.
By default, only the listener for Web UI would be enabled but if we want to add any other listeners then we can use spark. extra Listeners.
Spark comes with two listeners that showcase most of the activities
i) Stats Report Listener
ii) Event Logging Listener
Event Logging Listener: If you want to analyze further the performance of your applications beyond what is available as part of the Spark history server then you can process the event log data. Spark Event Log records info on processed jobs/stages/tasks. It can be enabled as shown below...
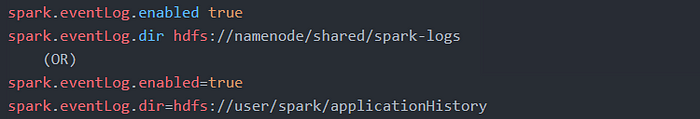
The event log file can be read as shown below
- The Spark driver logs into job workload/perf metrics in the spark. even Log. dir directory as JSON files.
- There is one file per application, the file names contain the application id (therefore including a timestamp) application_1540458187951_38909.
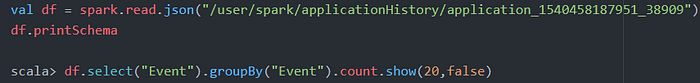
It shows the type of events and the number of entries for each.

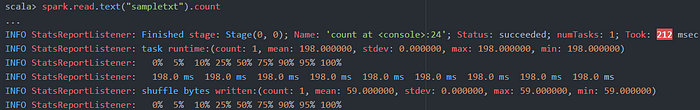
Now, let’s add Stats Report Listener to the spark. extra Listeners and check the status of the job.
Enable INFO logging level for org. apache. spark. scheduler. Stats Report Listener logger to see Spark events.

To enable the listener, you register it to Spark Context. It can be done in two ways.
i) Using Spark Context. add Spark Listener(listener: Spark Listener) method inside your Spark application.
Click on the link to implement custom listeners - Custom Listener
ii) Using the conf command-line option

Let’s read a sample file and perform a count operation to see the Stats Report Listener.
Execution of a job (Logical plan, Physical plan).
In Spark, RDD (resilient distributed dataset) is the first level of the abstraction layer. It is a collection of elements partitioned across the nodes of the cluster that can be operated on in parallel. RDDs can be created in 2 ways.
i) Parallelizing an existing collection in your driver program

ii) Referencing a dataset in an external storage system

RDDs are created either by using a file in the Hadoop file system, or an existing Scala collection in the driver program, and transforming it.
Let’s take a sample snippet as shown below

The execution of the above snippet takes place in 2 phases.
6.1 Logical Plan: In this phase, an RDD is created using a set of transformations, It keeps track of those transformations in the driver program by building a computing chain (a series of RDD)as a Graph of transformations to produce one RDD called a Lineage Graph.
Transformations can further be divided into 2 types
- Narrow transformation: A pipeline of operations that can be executed as one stage and does not require the data to be shuffled across the partitions — for example, Map, filter, etc..

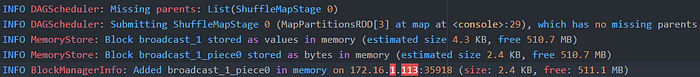
Now the data will be read into the driver using the broadcast variable.

- Wide transformation: Here each operation requires the data to be shuffled, henceforth for each wide transformation a new stage will be created — for example, reduce By Key, etc..

We can view the lineage graph by using to Debug String

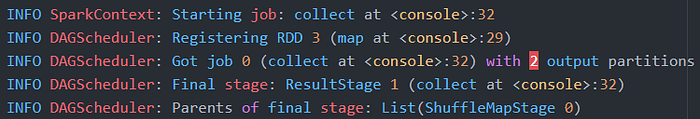
6.2 Physical Plan: In this phase, once we trigger an action on the RDD, The DAG Scheduler looks at RDD lineage and comes up with the best execution plan with stages and tasks together with Task Scheduler Impl and execute the job into a set of tasks parallelly.

Once we perform an action operation, the Spark Context triggers a job and registers the RDD until the first stage (i.e, before any wide transformations) as part of the DAG Scheduler.
Now before moving onto the next stage (Wide transformations), it will check if there are any partition data that is to be shuffled and if it has any missing parent operation results on which it depends, if any such stage is missing then it re-executes that part of the operation by making use of the DAG( Directed Acyclic Graph) which makes it Fault tolerant.
In the case of missing tasks, it assigns tasks to executors.

Each task is assigned to Coarse Grained Executor Backend of the executor.

It gets the block info from the Name node.

now, it performs the computation and returns the result.
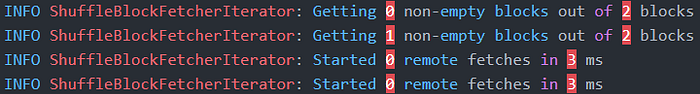
Next, the DAG Scheduler looks for the newly runnable stages and triggers the next stage (reduce By Key) operation.

The Shuffle Block Fetch erIterator gets the blocks to be shuffled.
Now the reduce operation is divided into 2 tasks and executed.

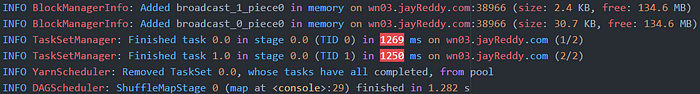
On completion of each task, the executor returns the result back to the driver.

Once the Job is finished the result is displayed.

Spark - Web UI
Spark-UI helps in understanding the code execution flow and the time taken to complete a particular job. The visualization helps in finding out any underlying problems that take place during the execution and optimizing the spark application further.
We will see the Spark-UI visualization as part of the previous step 6.
Once the job is completed you can see the job details such as the number of stages, the number of tasks that were scheduled during the job execution of a Job.

On clicking the completed jobs we can view the DAG visualization i.e, the different wide and narrow transformations as part of it.

You can see the execution time taken by each stage.

On clicking on a Particular stage as part of the job, it will show the complete details as to where the data blocks are residing, data size, the executor used, memory utilized and the time taken to complete a particular task. It also shows the number of shuffles that take place.

Further, we can click on the Executors tab to view the Executor and driver used.

Now that we have seen how Spark works internally, you can determine the flow of execution by making use of Spark UI, logs and tweaking the Spark Event Listeners to determine optimal solution on the submission of a Spark job.
Note: The commands that were executed related to this post are added as part of my GIT account.
Similarly, you can also read more here:
- Sqoop Architecture in Depth with code.
- HDFS Architecture in Depth with code.
- Hive Architecture in Depth with code.
If you would like too, you can connect with me on LinkedIn —Jayvardhan Reddy.
If you enjoyed reading it, you can click the clap and let others know about it. If you would like me to add anything else, please feel free to leave a response
Comments
Post a Comment